Expression
Library prep
- Direct or cDNA
- Direct sequencing
- Nanopore
- cDNA synthesis
- oligo-dT primer: slection is performed using poly(dT) primers to capture mRNAs. However, while 3’ end is working well, 5′ end side is not quite good…
- Random primer: quite even sequencing. However, over 80% of total RNA is rRNA.
- Specific primer:
- Direct sequencing
- Enrichment: select specific RNA to reduce the cost.
- PolyA capture for mRNA
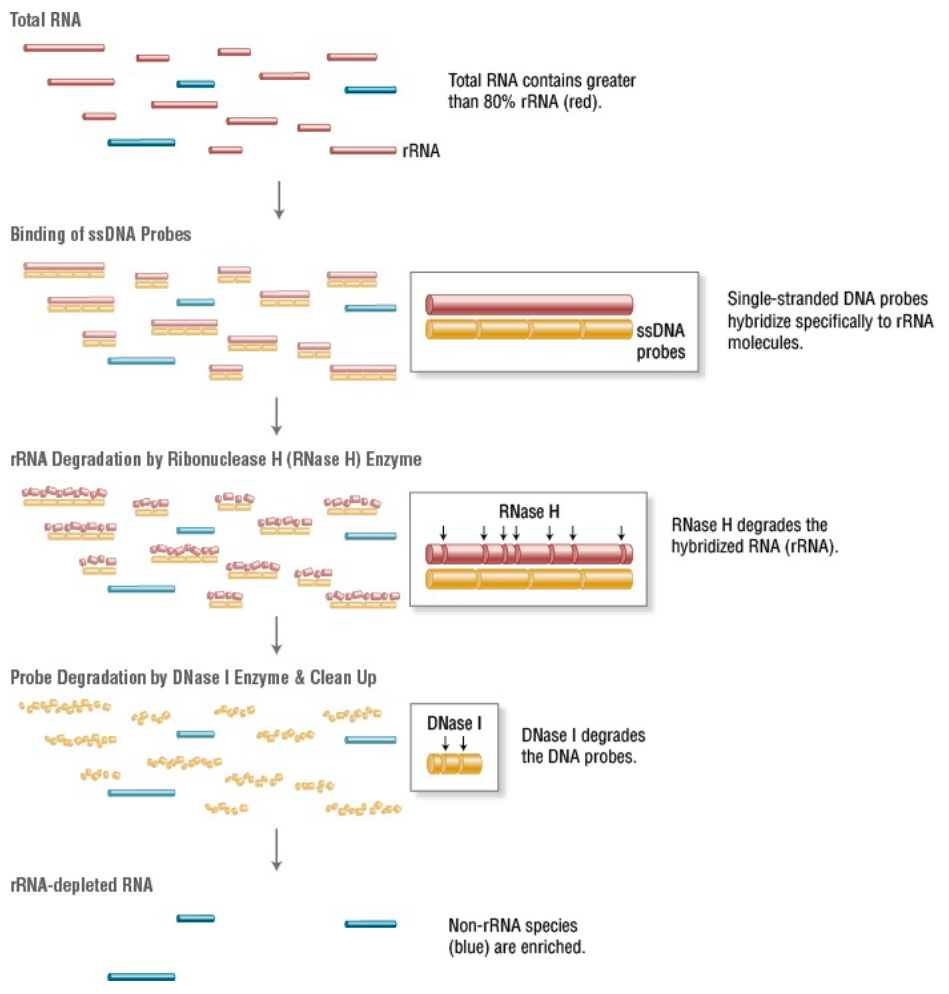
- rRNA depletion
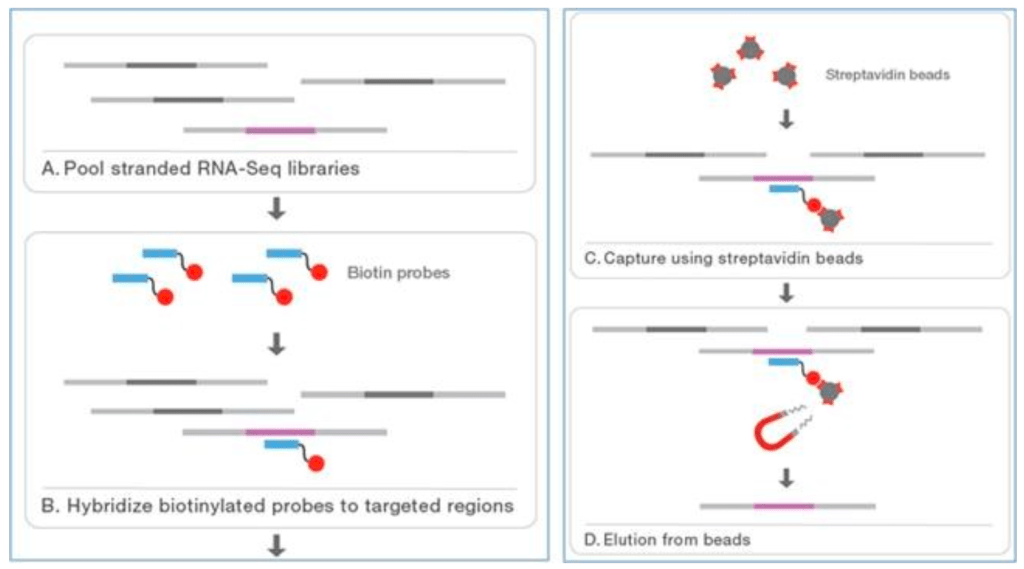
- Targeted sequencing
- Size selection for miRNA


- Total or Tag
- Total: 일반적으로 사용. Expression, alternative splicing 다 볼 수 있음
- Tag: 목적이 유전자 수를 세는 counting이라면, 전부 다 seq할 필요는 없다. 끝부분만 seq. 할 수 있음.
(참조: 3‘ end tag sequencing from http://www.e-biogen.com)
- Strand-specific or not
Seqeuence Variation in RNA
RNA modification (RNA editing)
Alternative Splicing
Gene Fusion (by inversion, translocation, …)
Novel Gene or Exon Discovery
Capstone Project
Data
1) Raw sequencing file (.fastq) = Reads
#Read1
@SRR1234567.1 1:N:0:ATCG
ATCGGCTAAGTTAGCT #Barcodes and UMIs
+
BBBBBBBBBBBBBBBB #Base quality scores
#Read2
@SRR1234567.1 2:N:0:ATCG
GGTACCTGATGCGTAC #RNA sequence read
+
CCCCCCCCCCCCCCCC #Quality scores2) Aligned file (.bam)
- Reads were aligned to the hg38 human reference using aligner
(Aligner: TopHat, STAR, Cell Ranger)
@HD     VN:1.6  SO:coordinate
@SQ     SN:chr1 LN:248956422
SRR1234567.1   99   chr1   1001   255   16M   =   1050   65   GGTACCTGATGCGTAC   CCCCCCFFFFFFF   NH:i:1   HI:i:1   NM:i:0
SRR1234567.1   147  chr1   1050   255   16M   =   1001  -65   ATCGGCTAAGTTAGCT   BBBBBBFFFFFFF   NH:i:1   HI:i:1   NM:i:0
File structure of .BAM in detail
Header lines:
@HD: File header with version (VN) and sorting order (SO).@SQ: Sequence dictionary, specifying the reference chromosome (SN) and its length (LN).
Alignment lines:
| Column | Name | Role | Example |
| 1 | QNAME | Read name | SRR1234567.1 |
| 2 | FLAG | Bitwise flag indicating the read’s properties | 99 |
| 3 | RNAME | Reference sequence name | chr1 |
| 4 | POS | Position of the first aligned base | 1001 or 1050 |
| 5 | MAPQ | Mapping quality | 255 means high confidence |
| 6 | CIGAR | Compact representation of alignment | 16M = 16 matched bases |
| 7 | RNEXT | Reference name of the mate read | = means same as current read |
| 8 | PNEXT | Position of the mate read | |
| 9 | TLEN | Insert size (distance between paired reads). | |
| 10 | SEQ | RNA sequence | GGTACCTGATGCGTAC |
| 11 | QUAL | Base quality scores | CCCCCCFFFFFFF |
| opt | NH:i:1 | Number of reported alignments for the read. | |
| opt | HI:i:1 | Alignment hit index. | |
| opt | NM:i:0 | Number of mismatches. |
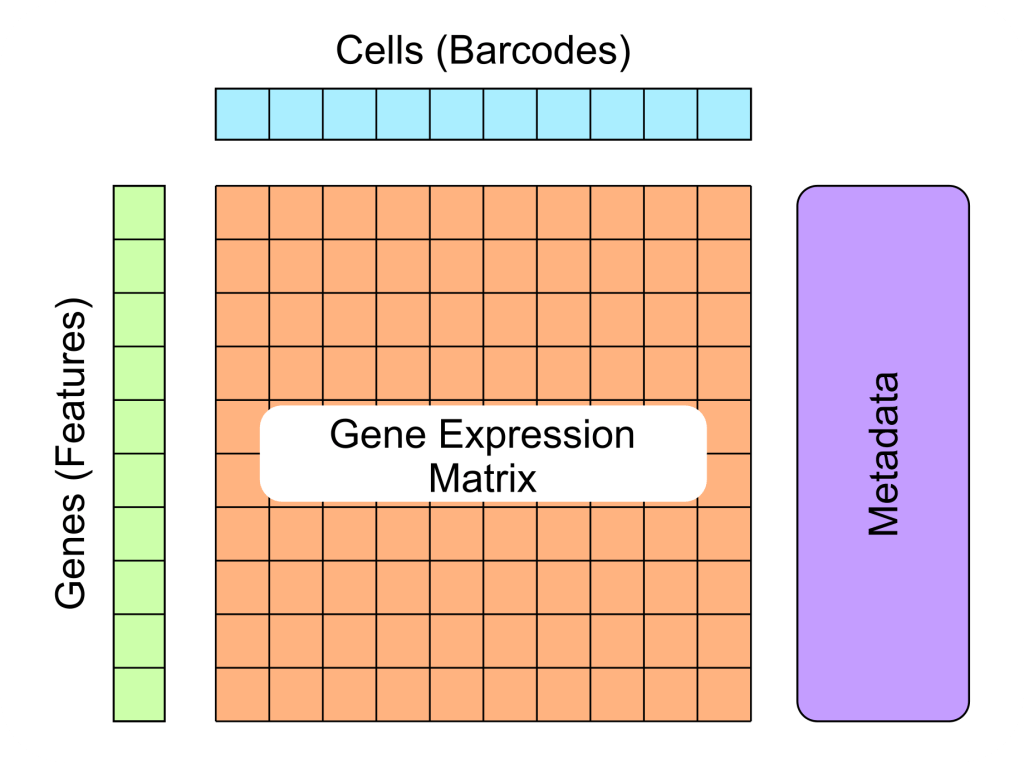
3) Gene-cell matrix (.mtx)
- Quantification of raw UMI counts
(Quantification pipeline: STARsolo, Cell Ranger, Kallisto)
matrix.mtx file
- Header: comment
- Size: (a) rows (b) columns (c) non-zero entries
- Data section: (a) by (b) table
features.tsv file = Genes
barcodes.tsv file = Cells
4) Quality control
- Filter cells based on UMI counts, gene coutns, and mitochondrial content.
Checklist from 🇸🇬
- Cells with less than 250 or more than 5,500 genes were excluded
- The maximum number of unique molecular identifiers (UMIs) was set at 30,000, and cells were required to have a log10 genes per UMI score of 0.78 or higher to address cell comoplexity.
- The mitochondrial ratio was restricted to <0.1
- A total of 29,283 cells and 18,467 genes were used in the study
- At the gene level, only genes expressed in 10 or more cells were included in the analysis.
4) Normalization and integration
Normalization: Adjusts raw UMI counts to account for technical effects (e.g., sequencing depth, library size).SCTransform: A normalization method that replaces traditional log-normalization.

- GATK Best practices pipeline to call variants.
- Variants were filtered by ANNOVAR
- Against on dbSNP, avSNP, ExAc to exclude normal variants and germline mutations
- ClinVar to filter benign, insignificant variants
- VCF file -> MAF object
- Plotting
- Cell-to-cell interaction
- Network plots
Software
R packages
- GSVA (Gene Set Variation Analysis)
- “singleCellTK”: to analyze gene set activity using GSVA scores
- “GSVA”: to measure cancer hallmark pathway activity
- “genefu”
- To calculate GSVA scores
- “maftools”
- VCF files converted to MAF object and analyzed
- “iTALK”
- Investigate cell-to-cell interaction between the tumor and immune cells.
(ligand-receptor gene pairs associated with immune checkpoint)
- Investigate cell-to-cell interaction between the tumor and immune cells.