mRNA analysis pipeline of the NCI’s Genomic Data Commons for data reporcessing.
Quality Control
- The number of uniquely mapped read >15M
- Uniquely mapped reads >75% of the total aligned reads.
DEG Analysis
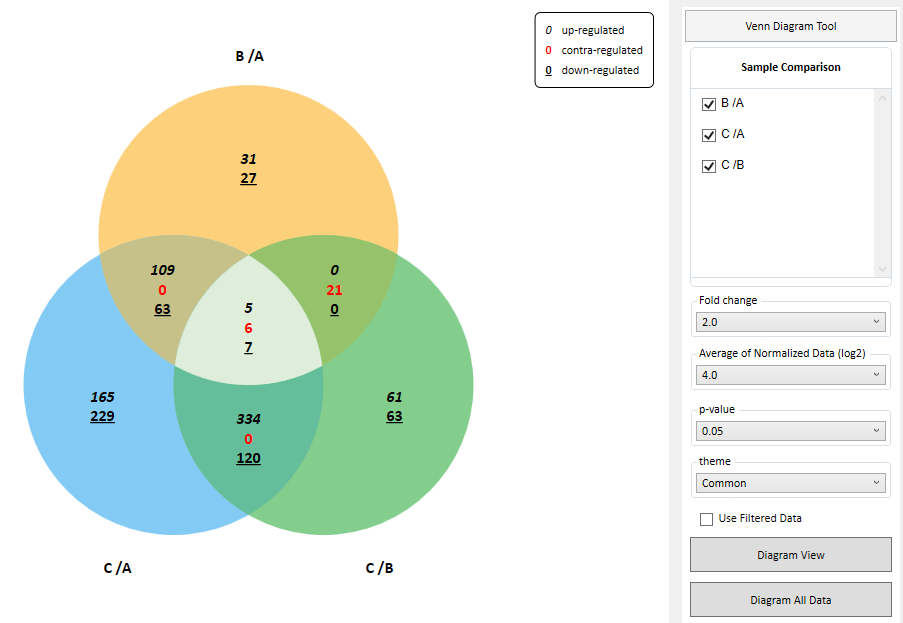
Significant Gene Selection
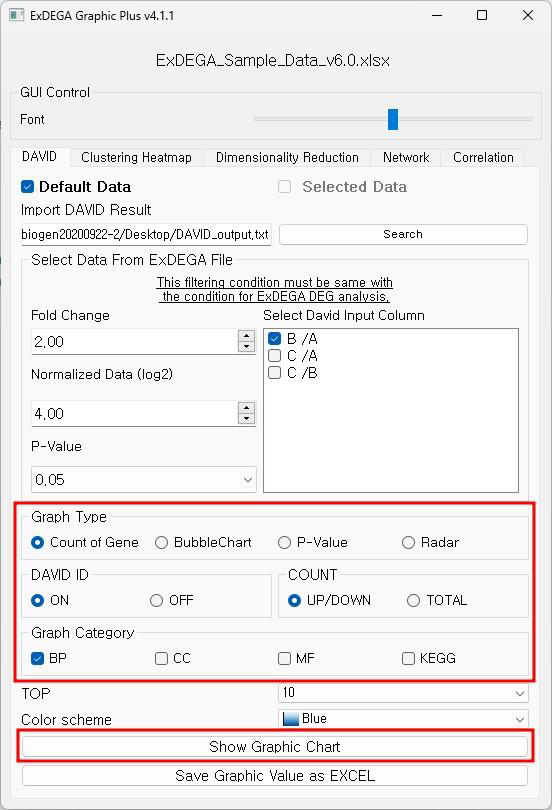
- Default setting
- Fold change: 2 / Normalized data (log): 4 / p-value: 0.05
- Sample/control group : B/A both, C/A both, C/B both
- Gene Category Chart
- 각 GO관련 유전자 중 발현이 유의하게 차이 나는 유전자의 %와 수를 나타낸 그래프
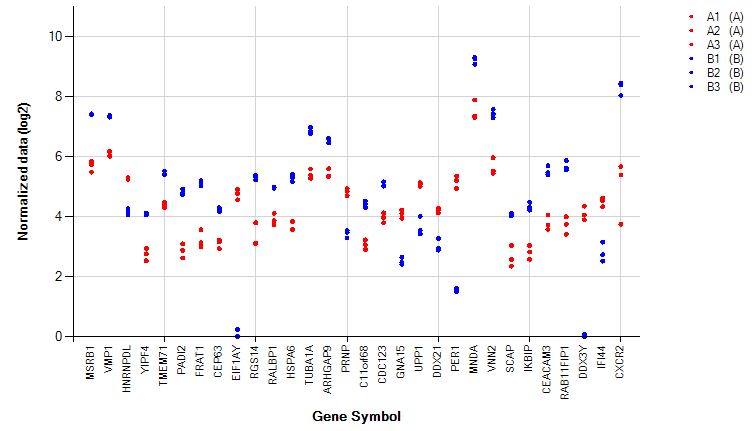
- Significant Chart
- 선택한 비교조합에 따른 유의한 유전자(최대 30개)의 발현 값을 그룹 별로 확인 (p-value 순으로 표시)

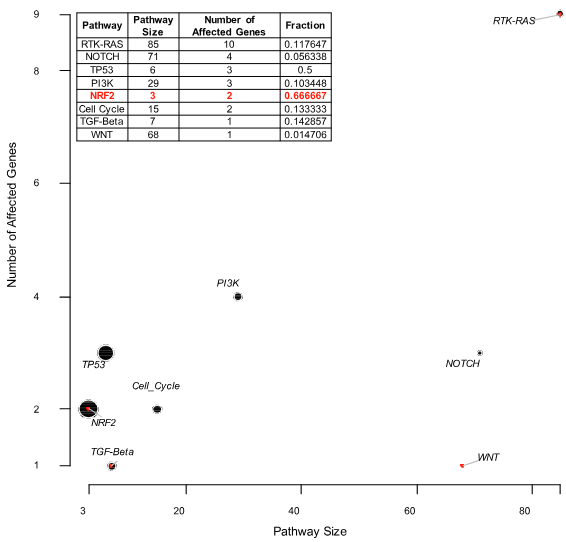
Mutational Profile

B.-S. Jang et al. / Radiotherapy and Oncology 142 (2020) 202–209
Mutational Signatures and Altered Pathway

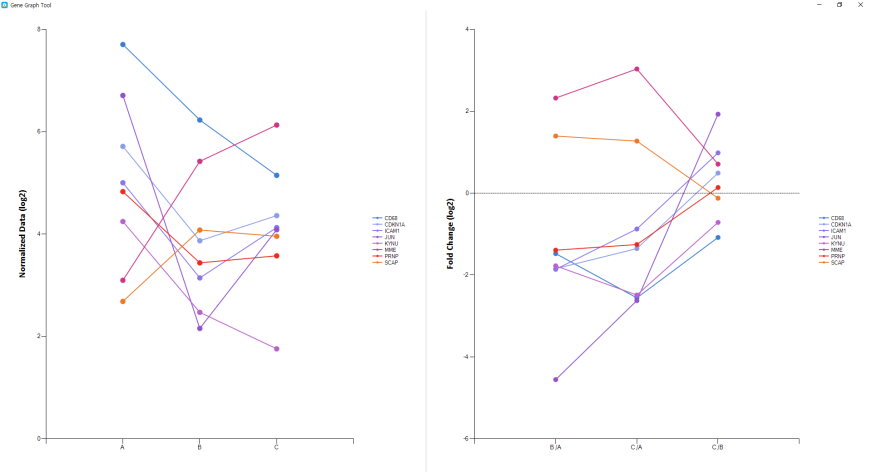
Basic Plots
Scatter Plot
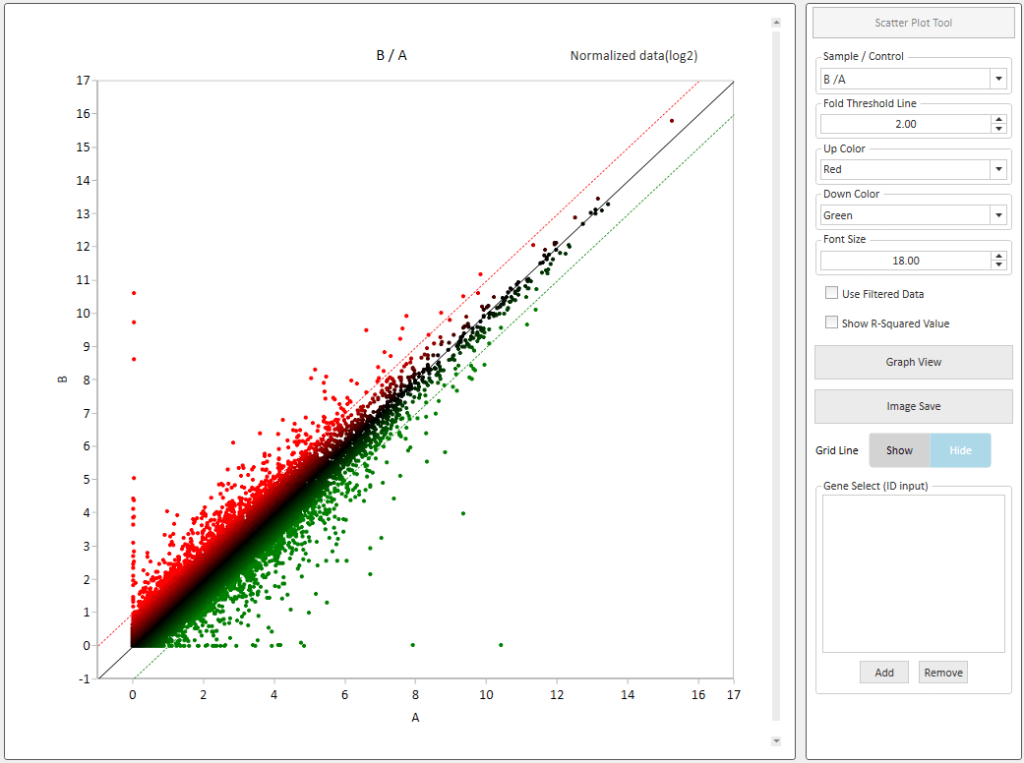
- 대조군과 실험군의 발현양상을 확인할 수 있는 이미지
- Setting: Sample/control group (e.g., B/A), fold threshold line (default: 2)
Volcano Plot

- 반복 실험(N>=2)이 된 경우에만 분석 가능하다. Volcano Plot은 Scatter Plot의 기능과 거의 동일.
Venn Diagram
t-SNE
KEGG input
GSEA input
Selected Gene Plot
- Select gene ID -> expression plot view
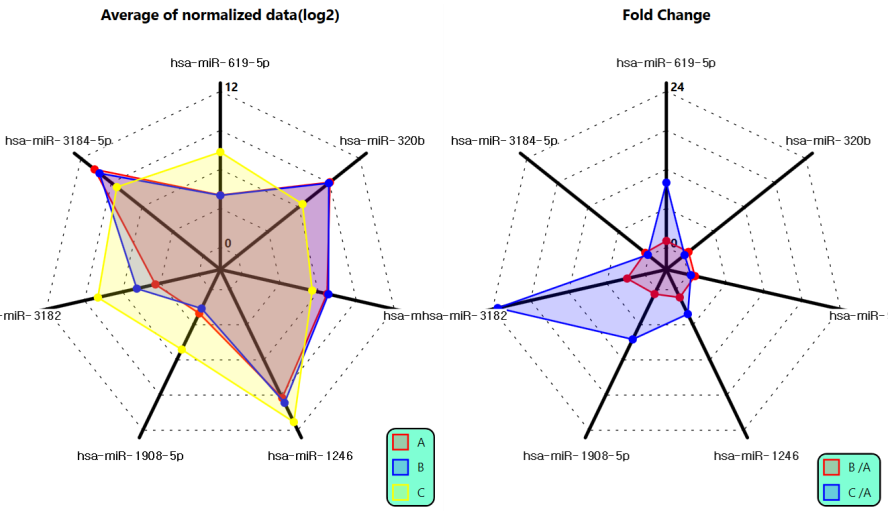
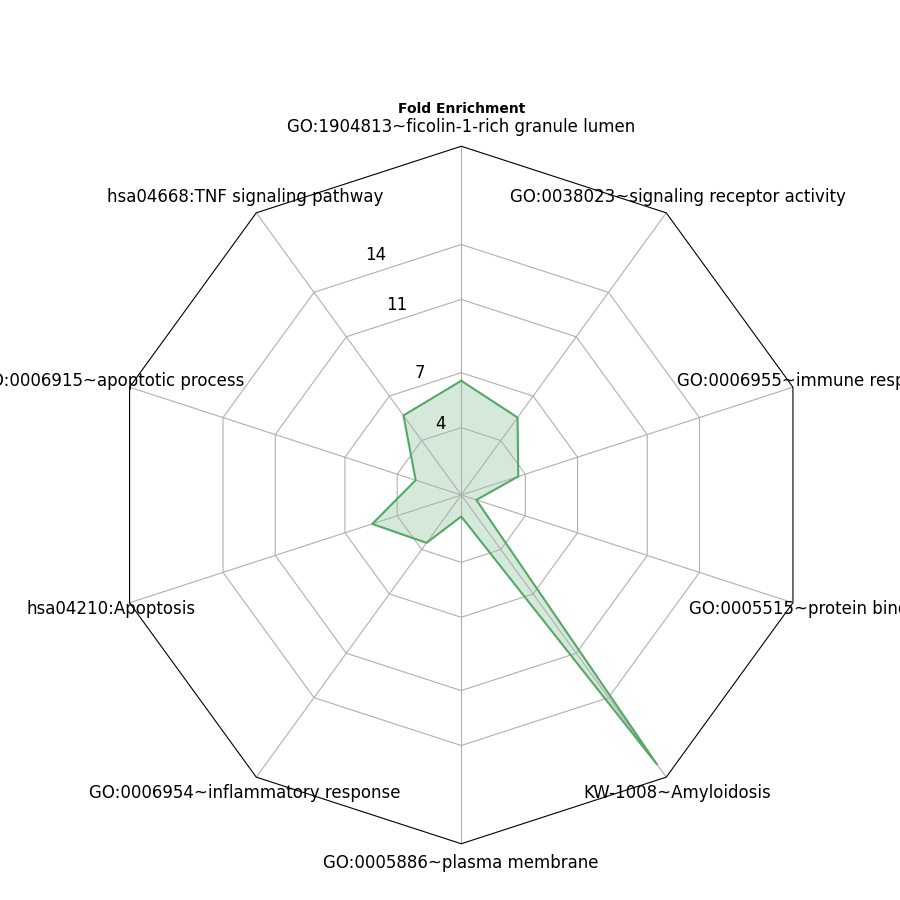
Radar Chart
Functional Annotation Analysis
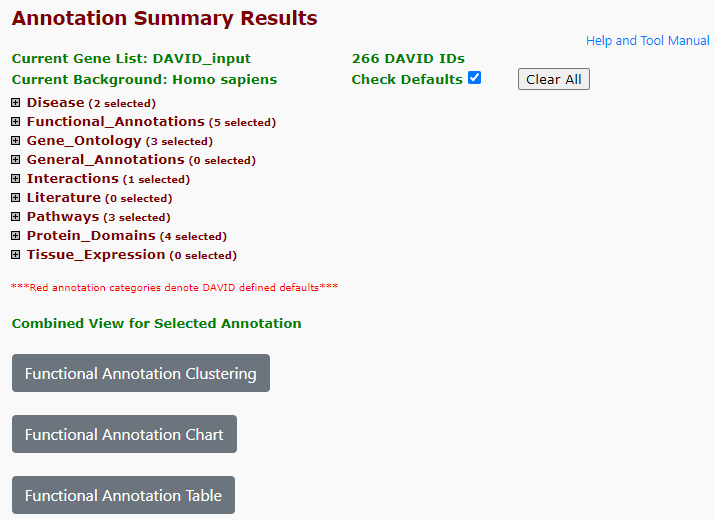
DAVID
The Database for Annotation, Visualization, and Integrated Discovery
Start from extracting ‘DAVID input data’ from ExDEGA
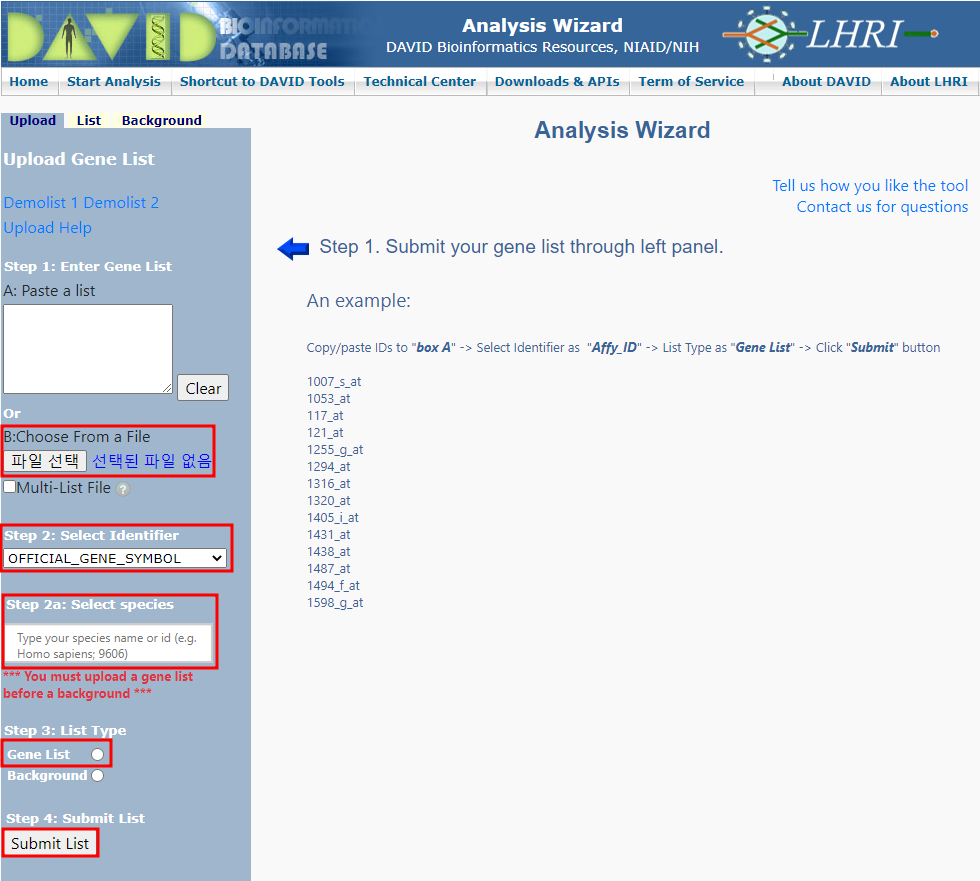
- Start Analysis
- Step 1: submit the gene list
- 1. DAVID input file upload
- 2. select official gene symbol (=identifier) (e.g., GENEBANK_ACCESSION)
- 3. Gene list / Background
- 4. convert list and submit to DAVID as a gene list
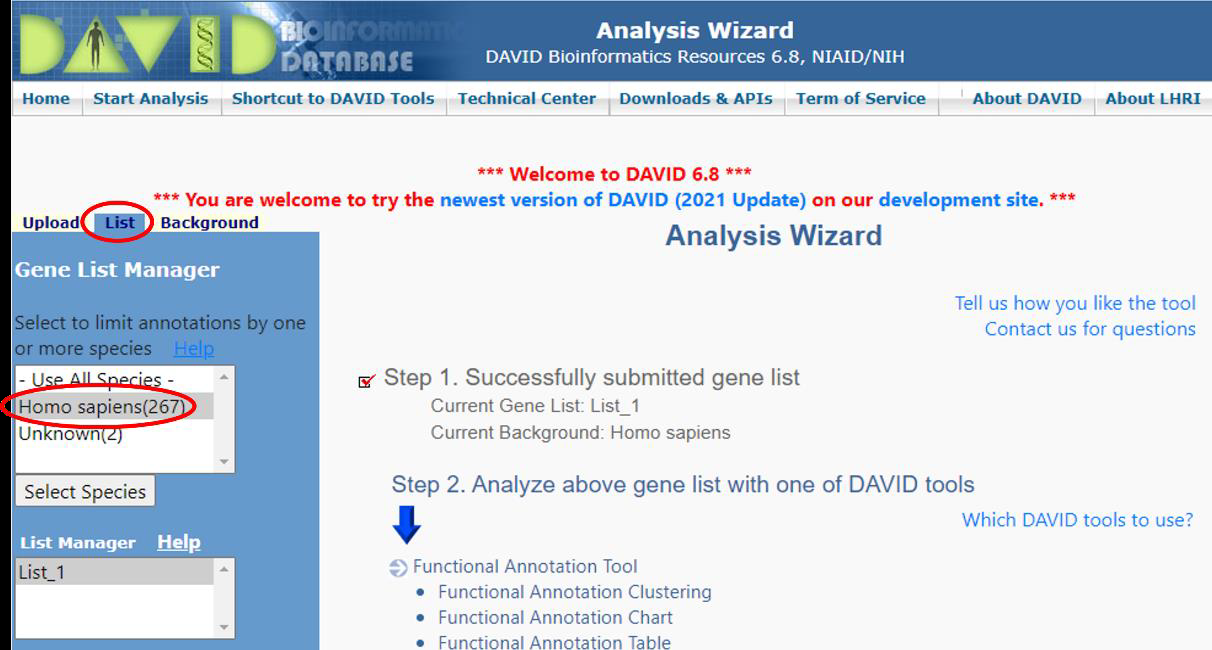
- Step 2: analyze with one of DAVID tools
- Step 3: functional annotation chart -> save the output file.
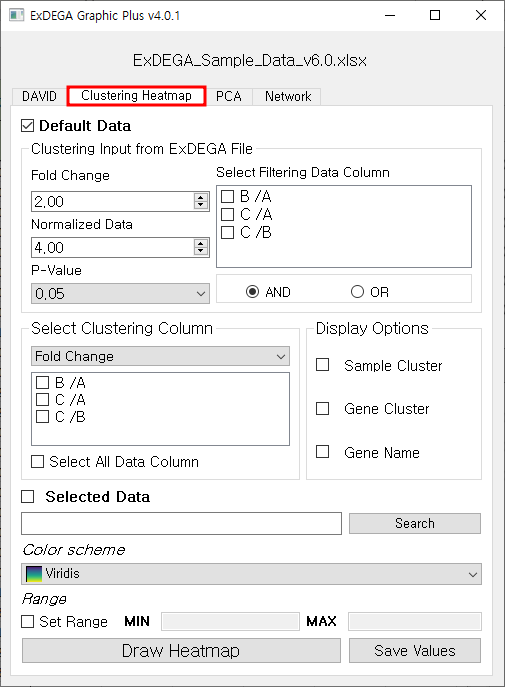
DAVID Graphic Analysis by ExDEGA GraphicPlus

Clustering Heatmap Analysis
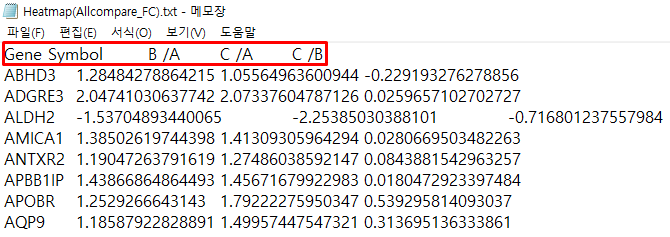
Clustering input
Producing ‘Clustering Heatmap Input.txt‘ file
- Using GraphicPlus or MeV program
- Type : Fold change / normalized data (Z-score) / average of normalized data (z-score)
- Export Data Select : B/A, C/A, C/B
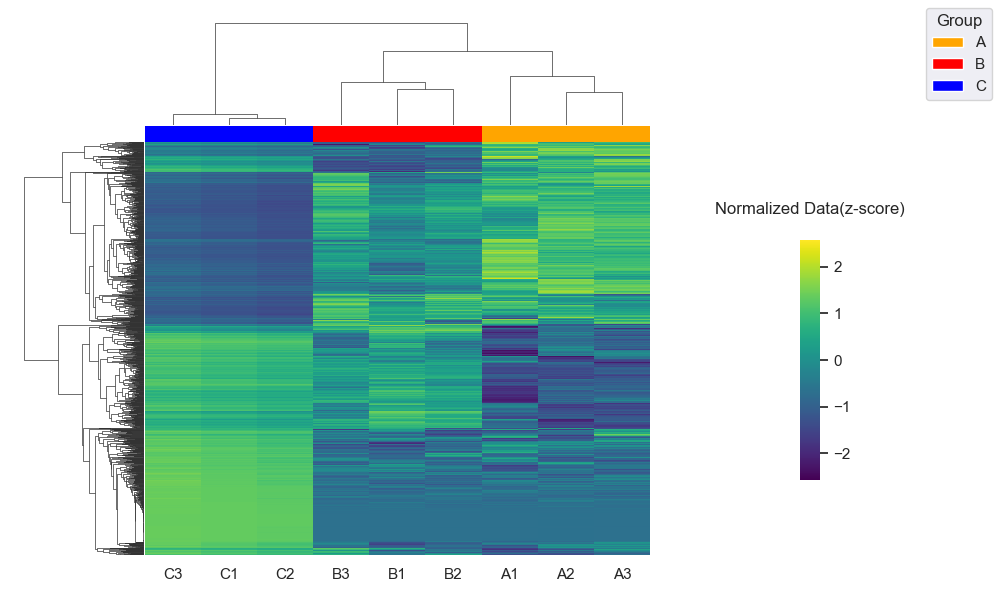
Hierarchical Clustering Heatmap by ExDEGA GraphicPlus
- Upper dendrogram: sample cluster (normalized data with Z-score)
- Leftside dendrogram: gene cluster
Dimensionality Reduction
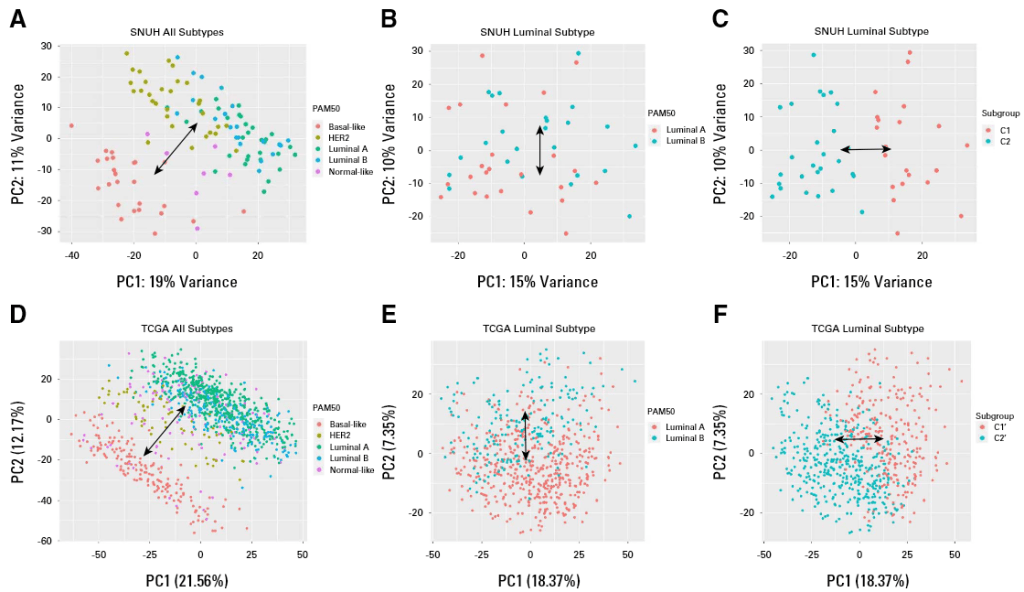
PCA (Principal Component Analysis)

UMAP

String Network Analysis
- Select genes of interest (<100)
- Draw -> saved as .svg file


SVG file
Excel file
- Node 1, node 2 and the interaction score between the two.
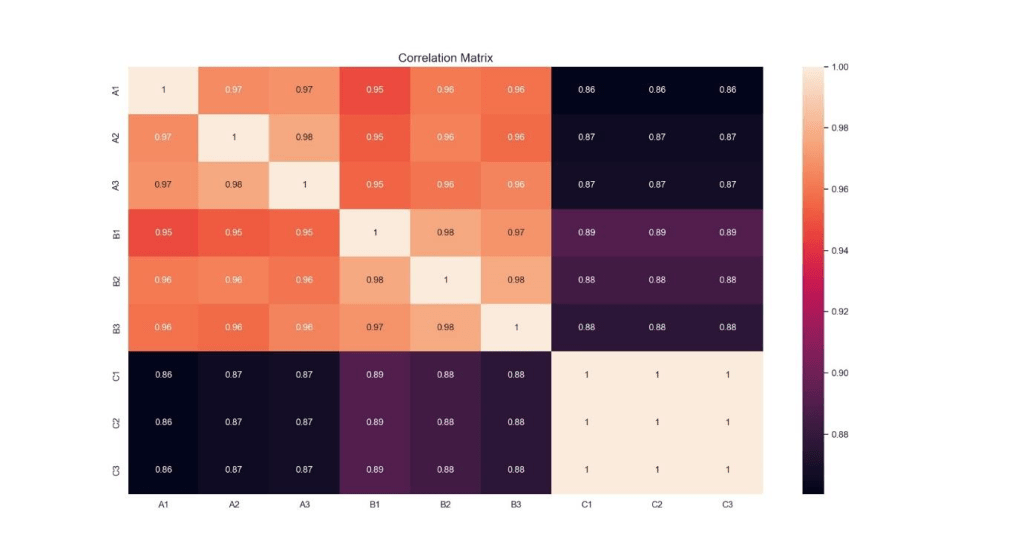
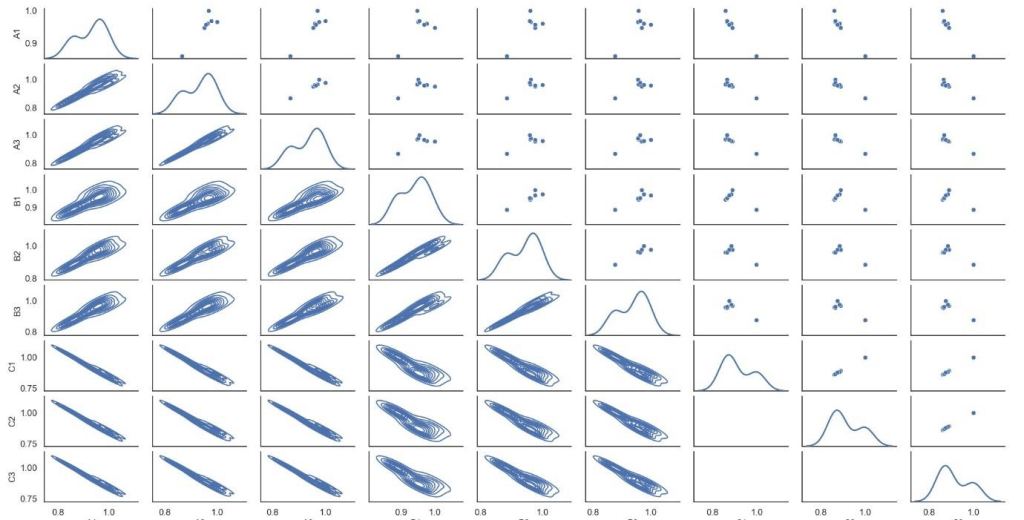
Correlation Analysis
HeatMap / PairGrid / Mix

Pathway Analysis
Using KEGG Mapper:
- https://www.genome.jp/kegg/mapper/
- Home > Color (species: hsa, if human)
Gene Set Enrichment Analysis (GSEA)
Microarray or RNA-seq data -> significant gene set analysis
- https://www.gsea-msigdb.org/gsea
- GSEA Software download: https://software.broadinstitute.org/gsea/downloads.jsp
- GSEA User guide: https://software.broadinstitute.org/gsea/doc/GSEAUserGuideFrame.html
GSEA report files
- ‘gsea_report_for_A_000’ : control group’s enriched gene set
- ‘gsea_report_for_B_000’: experimental group’s enriched gene set
Protein-Protein Network Analysis
Cytoscape STRING tool lets us identify the protein-protein interaction based on the database.
- Cytoscape Software download: http://www.cytoscape.org/