Introduction
The presence or absence of oxygen dramatically influences the biologic effect of X-rays
The nature of the oxygen effect
Survival curves for mammalian cells in the presence and absence of oxygen (Fig 6.1)
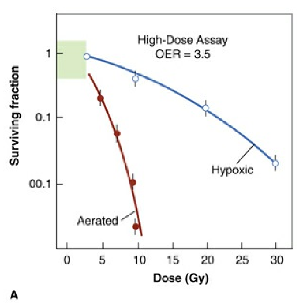
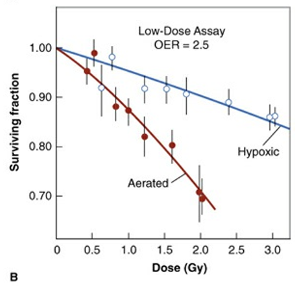
Cells are much more sensitive to x-rays in the presence of molecular oxygen than in its absence (i.e., under hypoxia). The ratio of doses under hypoxic to aerated conditions necessary to produce the same level of cell killing is called the oxygen enhancement ratio (OER).
It has a value close to 3.5 at high doses (A) but may have a lower value of about 2.5 at x-ray doses less than about 2 to 3 Gy (B).
- Oxygen enhancement ratio (OER) : the ratio of doses administered under hypoxic to aerated conditions that produce the same biologic effect
- OER for X- and ɤ- ray, between 2.5 and 3.5 at high doses, about 2.5 at lower doses
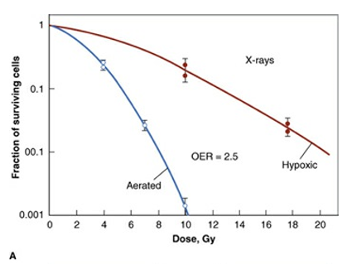
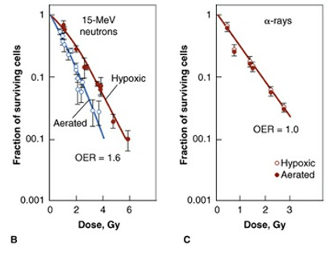
: d/t the variation of OER with the phase of cell cycle - The OER decreases as linear energy transfer increases. The OER approaches unity (i.e, no oxygen effect) for α-particles. For neutrons, the OER has an intermediate value of about 1.6 (Fig 6.2)
The time at which oxygen acts and the mechanism of the oxygen effect
- To produce its effect, oxygen must be present during or within microseconds after the radiation exposure
- Oxygen need not be present during the irradiation but could be added afterward, provided the delay was not too long
- Mechanism of the oxygen effect : oxygen acts at the level of the free radicals.
Chain of events from the absorption of radiation to the final biologic damage:
Absorption of radiation → production of fast charged particles
→ production of ion pairs (very short life spans : about 10-10 second)
→ production of free radicals (life spans : about 10-5 second)
→ break chemical bonds, produce chemical changes, biologic damage
→ extent of the damage depends on the presence or absence of oxygen - If oxygen present
DNA reacts with the free radical (R·)
→ formation of RO2· (nonrestorable form of target material)
→ change in the chemical composition of the material exposed to radiation
→ oxygen “fix” or make permanent the radiation lesion : oxygen fixation hypothesis
The concentration of oxygen required
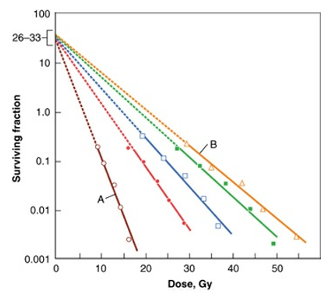
Fig 6.4
Survival curves for Chinese hamster cells exposed to x-rays in the presence of various oxygen concentrations.
Open circles, air (A);
closed circles, 2200ppm of oxygen or pO2 of 1.7mmHg;
open squares, 355 ppm of oxygen or pO2 of 0.25 mmHg;
closed squares, 100 ppm of oxygen or pO2 of 0.075mmHg;
open triangles, 10ppm of oxygen or pO2 of 0.0075mmHg (B) which corresponded to the lowest level of hypoxia that could usually be obtained under experimental conditions.
- 0.22% oxygen (concentration of 2200 ppm) moves the survival curve about halfway toward the fully aerated condition
- By the time a concentration of oxygen corresponding to 2% has been reached, the survival curve is indistinguishable from that obtained under condition of normal aeration
- Increasing the amount of oxygen present from that characteristic of air to 100% oxygen does not further affect the slope of the curve
- Representation of the dependence of radiosensitivity on oxygen concentration (Fig 6.5)
* Radiosensitivity : reciprocal of the D0 of the survival curve
* Oxygen concentration increases progressively more sensitive to radiation
* In the presence of 100% oxygen : 3 times as sensitive as under complete anoxia
* Rapid change of radiosensitivity : pressure of oxygen from 0 to 30mmHg (5% oxygen)
* Oxygen concentration of 0.5% (about 3mmHg) : halfway between the hypoxia and fully oxygenenation

Fig 6.5
If the radiosensitivity under extremely anoxic conditions is arbitrarily assigned a value of unity, the relative radiosensitivity is about 3 under well-oxygenated conditions. most of this change of sensitivity occurs as the oxygen tension increases from 0 to 30mmHg. A further increase of oxygen content to that characteristic of air or even pure oxygen at high pressure has little further effect. A relative radiosensitivity halfway between anoxia and full oxygenation occurs for a pO2 of about 3 mmHg, which corresponds to a concentration of about 0.5% oxygen. This illustration is idealized and does not represent any specific experimental data.
Chronic and Acute hypoxia
- Two forms of hypoxia that are the consequence of different mechanisms : chronic and acute hypoxia
- Chronic hypoxia results from the limited diffusion distance of oxygen through the respiring tissue
- Acute hypoxia is the result of the temporary closing of tumor blood vessels owing to the malformed vasculature of the tumor
Chronic hypoxia
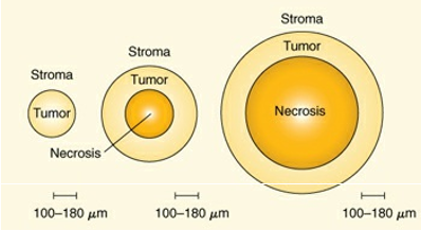
Fig 6.7
The conclusions reached by Thomlinson and Gray from a study of histologic sections of human bronchial carcinoma. No necrosis was seen in small tumor cords with a radius of less than about 160 μm. No tumor cord with a radius exceeding 200 μm was without a necrotic center. As the diameter of the necrotic area increased, the thickness of the sheath of viable tumor cells remained essentially constant at 100 to 180 μm.
Thomlinson and Gray : as the tumor cord grows larger, the necrotic center also enlarges so that the thickness of the sheath of viable tumor cells remains constant (Fig 6.7)
Oxygen depletion → the principal factor leading the development of necrotic areas in tumors
The distance oxygen can diffuse : 70μm
Cells in the region of oxygen tension high enough for cells to be clonogenic but low enough to render the cells protected from the effect of ionizing radiation focus for the subsequent regrowth of the tumor (Fig 6.8)

Fig 6.8
The diffusion of oxygen from a capillary through tumor tissue. The distance to which oxygen can diffuse is limited largely by the rapid rate at which it is metabolized by respiring tumor cells. For some distance from a capillary, tumor cells are well oxygenated. At greater distances, oxygen is depleted, and tumor cells become necrotic. Hypoxic tumor cells form a layer, perhaps one or two cells thick, in between. In this region, the oxygen concentration is high enough for the cells to be viable but low enough for them to be relatively protected from the effects of x-rays. These cells may limit the radiocurability of the tumor. The distance to which oxygen can diffuse is about 70 μm at the arterial end of a capillary and less at the venous end.
Acute hypoxia
- Result of the temporary closing or blockage of a particular blood vessel
- Tumor blood vessels open and close in a random fashion → intermittent hypoxic region
- Fig 6.9 difference between chronic and acute hypoxia
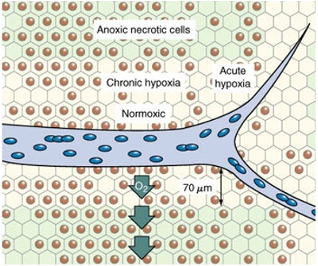
Fig. 6.9
Diagram illustrating the difference between chronic and acute hypoxia. Chronic hypoxia results from the limited diffusion distance of oxygen in respiring tissue that is actively metabolizing oxygen. Cells that become hypoxic in this way remain hypoxic for long periods until they die and become necrotic. Acute hypoxia results from the temporary closing of tumor blood vessels. The cells are intermittently hypoxic because normoxia is restored each time the blood vessel opens up again.
The first experimental demonstration of hypoxic cells in a tumor
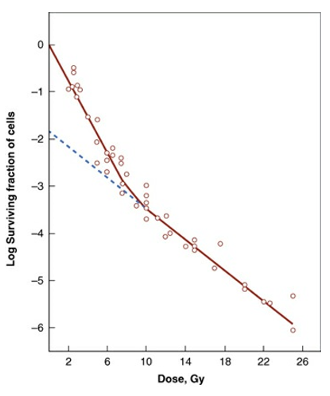
Fig 6.10
The dilution assay technique used by Powers and Tolmach to investigate the radiation response of a solid subcutaneous lymphosarcoma in the mouse. (Fig 6.10)
The survival curve consists of two separate component : final slope about 2.5 times shallower than initial
- Up to a dose of about 9 Gy, slope(D0): 1.1 Gy
- Second shallower slope (D0): 2.6 Gy
- → Suggest that the tumor consists of two separate groups: oxygenated, hypoxic
(about 1% of the clonogenic cells in the tumor were deficient in oxygen)
- → Suggest that the tumor consists of two separate groups: oxygenated, hypoxic
Proportion of hypoxic cells in various animal tumors
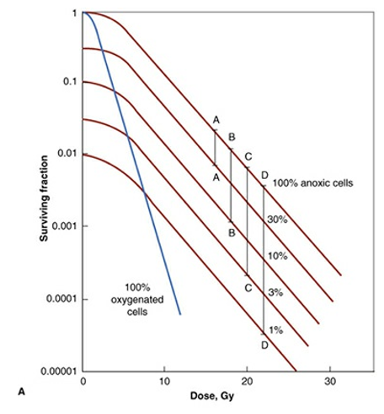
Fig 6.11A
Investigations about the fraction of hypoxic cells in a wide variety of tumors in experimental animals
Most widely used method is to obtain paired survival curves (Fig. 6.11A)
* The steepest curve : fully oxygenated population
The uppermost curve : entirely hypoxic cells
* Survival curve for mixed population
At low dose, closely follow that for the oxygenated population
At higher doses, parallel to the curve of hypoxic population
(The number surviving oxygenated cells is negligible compared with the number of anoxic cells)
* Fraction of hypoxic cells in the tumor
→ Distance between the parallel terminal slope
Moulder and Rockwell : survey of published data on hypoxic fraction
→ 37 of 42 tumor types contain hypoxic cells at least one study
Hypoxic fractions vary from 0 to 50% with a tendency to average about 15%.
Evidence for hypoxia in human tumors
Oxygen probe, hypoxia markers, comet assay and noninvasive imaging: mostly oxygen probe
Techniques to measure tumor oxygenation
- Oxygen probe measurements : implant electrode directly into tumors, Eppendorf probe
- Marker of hypoxia:
* 2-Nitroimidazole (bind irreversibly to macromolecule in hypoxic cell)
Advantage: Provide the relative oxygen concentrations on an individual cell basis
Distinguish between viable and necrotic tissue
Distinguish between chronic and acute hypoxia
* Noninvasive hypoxia imaging: PET, SPECT imaging agents (F-18-miso,F-18-EF5, 60-Cu-ATSM, I-123-IAZA)
* Immunohistochemistry for endogenous hypoxia markers: CA9, HIF
Reoxygenation
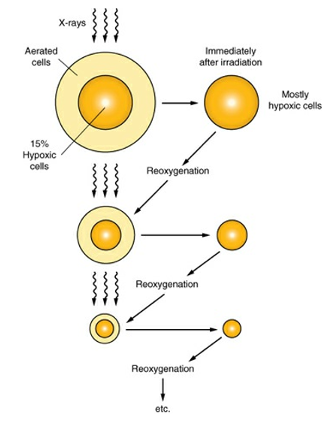
Fig 6.13
The process of reoxygenation. Tumors contain a mixture of aerated and hypoxic cells. A dose of x-rays kills a greater proportion of aerated cells than hypoxic cells because aerated cells are more radiosensitive. Therefore, immediately after irradiation, most cells in the tumor are hypoxic. However, the preirradiation pattern tends to return because of reoxygenation. If the radiation is given in a series of fractions separated in time sufficient for reoxygenation to occur, the presence of hypoxic cells does not greatly influence the response of the tumor.
Hypoxic cells become oxygenated after a dose of radiation → reoxygenation (Fig 6.13)
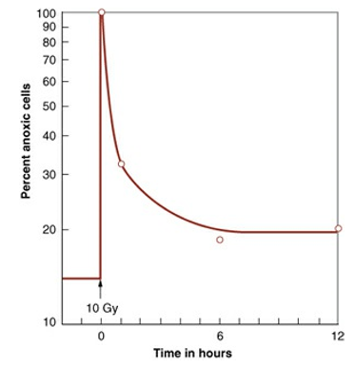
Time sequence of reoxygenation
If reoxygenation is rapid and complete, hypoxic cells have little influence on the outcome of a fractionated radiation schedule. (Fig 6.14)
he extent of reoxygenation and the rapidity with which it occurs vary widely for different experimental animal tumors. (Fig 6.15)
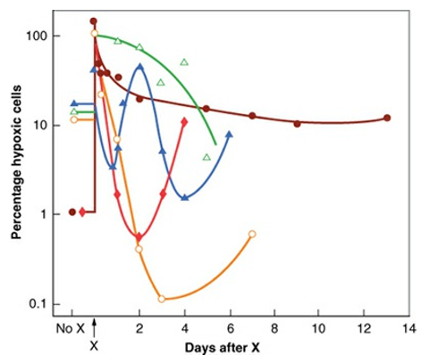
Mechanism of reoxygenation
- Different timescale of reoxygenation in different animal model
→ Reflect the different type of hypoxia : chronic vs acute
Slow component : chronically hypoxic cells as the tumor shrinks become close to blood supply, over days
Fast component : reoxygenation of acutely hypoxic cells as temporarily closed vessels reopen, within hours
The importance of reoxygenation in radiotherapy
Reoxygenation cannot be measured in human tumors, but presumably it occurs at least in those tumors controlled by conventional fractionated radiotherapy.
Hypoxia and chemoresistance
- Owing to fluctuating blood flow, drug diffusion distance, and decreased proliferation
- Some agent that induce DNA damage (doxorubicin, bleomycin): d/t decreased free-radical generation
- 5-FU, methotrexate, cisplatin: less effective at killing hypoxic cells
- Hypoxic regions → low PH: diminish the activity of some chemo agent
Hypoxia and tumor progression
- German: correlation between local control in advanced cervix cancer and oxygen-probe measurement
<10 mmHg pO2 → indicator of tumor aggressiveness - Canadian: most failures occurred in the poorly oxygenated tumors with distant tumor outside the pelvis
- US: osteosarcoma, correlation between tumor oxygenation and the frequency of distant metastasis
- Danish: soft tissue sarcoma, increased risk of metastatic spread, if low tumor pO2 value