1 Dose-response relationships
– Absorbed dose ∝ incidence, severity of radiation effect
– Absorbed dose and incidence curve: sigmoid shape (tumor control, normal-tissue complication)
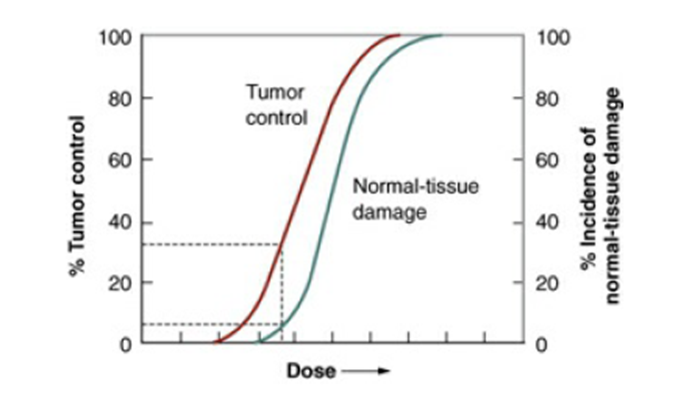
2 Therapeutic ratio (therapeutic index)
– The ratio of the tumor response for a fixed level of normal-tissue damage
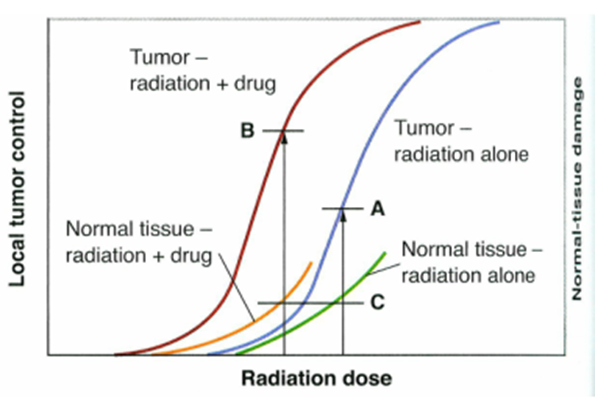
– The addition of a drug, a chemotherapy agent or a radiosensitizer, moves the tumor control curve to the left farther than the normal tissue damage curve à therapeutic gain. (Figure 19.2)
3 Types of cell death: How and Why cell die
– Mitotic linked cell death, necrotic death, apoptotic death, autophagic death, bystander induced death
– Mitotic-linked cell death and apoptotic cell death are responsible for most cell killing by radiation
a. mitotic death: die attempting to divide, does not necessarily occur at the first post irradiation mitosis
– apoptosis: programmed cell death, cell condensation, membrane-enclosed bodies are phagocytized by nearby tissue cell
affects scattered individual cells à no tissue disorganization that occurs after necrosis
4 Assays for dose-response relationships
Clonogenic end points
a. clones regrowing in situ
: skin colony, regenerating crypts in the jejunum, testes stem cell, kidney tubule
b. cells transplanted to another site
:can manipulate the physiologic states of donor or recipient animals hormonally
: bone marrow stem cell, mammary and thyroid cell
– Functional end points
a. skin (pig, rodent, etc)
breathing rate (early and late response of the lung)
spinal cord myelopathy
– Inferring the ratio alpha/beta
5 Clonogenic end points
1) Clones regrowing in situ
a. skin colony: by Withers, 30 Gy of 30-kv x ray, moat, test dose,
– Technique (Figure 19.3)
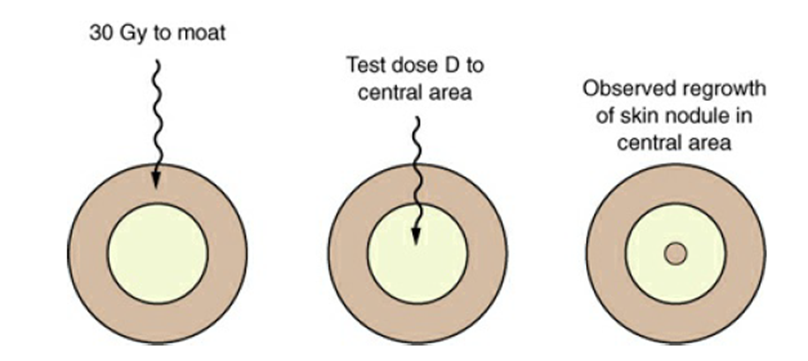
D0=1.35 Gy à similar to the value obtained with mammalian cells cultured in vitro
Dq=3.5 Gy à similar to the value for human skin estimated from split-dose experiments
– Limitation:
- range in which the dose-response relationship can be determined (8~25 Gy)
- we don’t know how many skin stem cells there are per unit area
b. Crypt cells of the mouse jejunum
– by Withers and Elkind, regenerating crypts per circumference of the sectioned jejunum
– Technique
total body irradiation to animals àsterilizes a significant proportion of the dividing cells in the crypts à after 3.5 days, sections of the jejunum are made à the number of regenerating crypts per circumference is scored.
– Limitation (Figure 19.8)
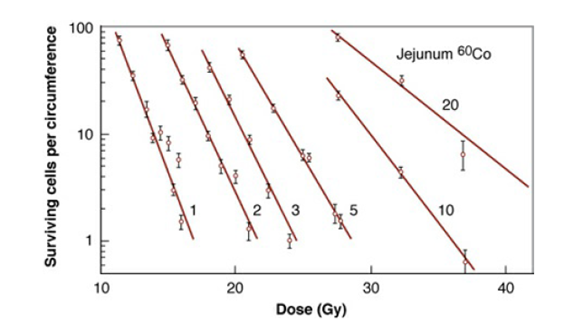
- the quantity plotted on the ordinate is not the surviving fraction
- experiments can be done only at doses of about 10 Gy or more
- -> sufficient level of biologic damage to be identified
c. Testes stem cells
– by Withers, et al, 6 weeks after irradiation, the proportion of tubules containing spermatogenic epithelium
– 8-16 Gy, D0=1.68 Gy, Dq=2.7 Gy by split-dose tech., reconstruction of survival curve (Figure 19.11, 19.12)
d. Kidney tubule
– by Withers, et al, the first clonal assay for a late-responding tissue,
– Technique
Irradiation to one kidney per mouse with small field à histologic examination after 60 weeks – The radiosensitivity of late responding tissue is not very different from that of early-responding tissues, such as the skin or intestinal epithelium. The rate of response, however, is quite different. (The time required for depletion of the epithelium after a single dose of 14 Gy: 3 days for jejunum, 24 days for the skin, 30 days for the seminiferous tubules 300 days for the kidney tubules) à the slow expression of injury merely reflects the slow turnover of cell population
2) Cells transplanted to another site
a. bone marrow stem cell
– by Till and McCulloch, a survival curve for colony-forming bone marrow cells
– Technique
- Supralethal radiation with dose of 9 ~10 Gy sterilized spleens of recipient animals
- A donor animal is irradiated to some test dose
- The suspension of cells from the bone marrow is inoculated into recipient animals
- This procedure is repeated for a range of doses à a survival curve is obtained.
– Bone marrow stem cells are very sensitive with a D0 of about 0.95 Gy (Figure 19.17)
b. Mammary and thyroid cells
– Technique
- irradiated in vivo à cell suspension
- inject into the inguinal or interscapular white fat pads of recipient animal
- count mammary or thyroid structures 3.5 weeks after injection
3) Summary of survival curves for clonogenic assays of cells from normal tissues

– The width of the shoulder of the curve is the principal variable.
Jejunal crypt cells have a very large shoulder; bone-marrow stem cells have little
6 Dose-response relationships for functional end points
a. Pig skin
– many features are in common with human skin
– can be extrapolated to the human with a high degree of confidence
– pioneered by Flowler and colleagues, scoring of skin reaction after irradiation
– two phase reaction (early reactionà erythema, etc, late reactionà contraction, etc)
b. Rodent skin
– Mouse leg and foot (one hind leg à experiment, the other leg à control)
– appear by about the 10th days and peaked by 20 to 25 days (Figure 19.23)
– Second wave of the reaction: not observed in mice, but in rat.
c. Breathing rate
– Breathing frequency increases progressively with dose after a threshold of about 11 Gy (Figure 19.24)
– Early response (16-36 weeks, pneumonitis), late response (by 52 weeks, fibrosis)
– A simple but highly quantitative and reproducible system
d. spinal cord myelopathy
- The various syndromes of radiation-induced injury in rodent brain and spinal cord are very similar to those described in humans
- Latent periods of 4-12 months
- Cause of damage
- within first 6 months: white matter damage (focal or diffuse demyelination and necrosis)
- late delayed injury peaks at 1 to 2 years postirradation :
- common type: vascular basis
- another type: slowly progressive glial atrophy
- Latency: the general tendency is a decreasing latency with increases in dose of approximately 2 days/Gy
- Fractionation and protraction
- dramatic sparing from fractionation
- interfraction time less than 4 hours à incomplete repair
if multiple doses per day are used to the spinal cord, the interfraction interval should be at least 6 to 8 hours
- Volume effect:
① Spinal cord : functional subunits (FSUs) are arranged in linear fashion
② marked dependence of spinal cord length below 1cm (Figure 19.27)
③ Beyond a few centimeters, the tolerance is virtually independent of length of cord
- Retreatment after long time intervals
- The extent of recovery depends on the first treatment
- Experiments with rats: After an initial treatment to 50% tolerance, the retreatment tolerance approaches 90% of the tolerance of the untreated control group by about a year after the initial irradiation
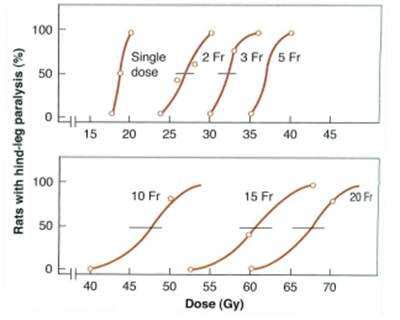
7 Inferring the ratio α/β from multifraction experiments in nonclonogenic systems
a. Assumption
- linear-quadratic model
- each dose in a fractionated regimen produces the same biologic effect
- full repair of sublethal damage takes place between dose fractions, but no cell proliferation occurs
b. Suppose the total dose, D, is divided into n equal fractions of D.
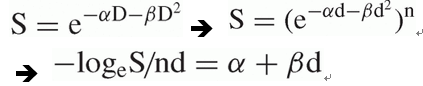
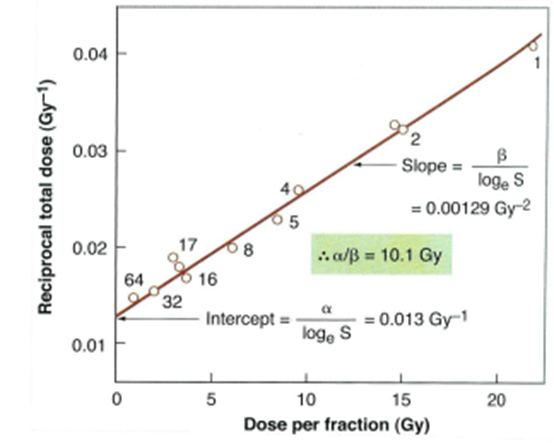
(1/nd) is plotted against the dose per fraction (d)
c. α/β ratio tends to be larger for early-responding tissues, about 10 Gy, than for late-responding tissues, about 2 Gy.
김경수교수님 ROJ paper
breast cancer, brain mets
* Radiobiologic consideration > dose-fx이 다른 여러 trial을 바탕으로 점을 찍어서 alpha/beta ratio를 구할 수 있다. 이런식으로 측정한다는 것을 보면 좋음.